NASHVILLE, Tenn.--(BUSINESS WIRE)--Atmus Filtration Technologies Inc. (Atmus; NYSE: ATMU), a global leader in filtration and media solutions, today reported financial results for its fourth quarter and full year that ended December 31, 2023.
Fourth Quarter and Full Year Highlights
- Net sales of $400 million for the fourth quarter and $1,628 million full year
- GAAP net income of $35 million for the fourth quarter and $171 million full year
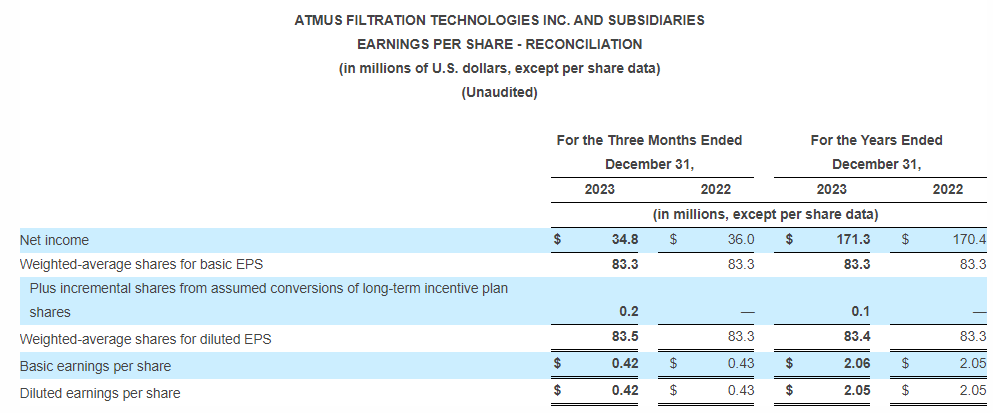
- Diluted earnings per share of $0.42 for the fourth quarter and $2.05 full year
- Adjusted earnings per share of $0.49 for the fourth quarter and $2.31 full year
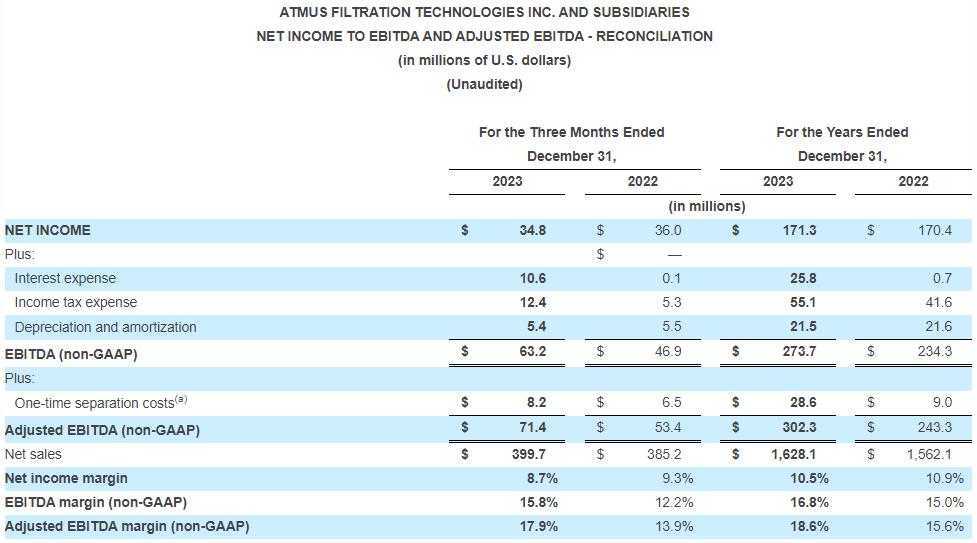
- Adjusted EBITDA of $71 million and adjusted EBITDA margin of 17.9% for the fourth quarter
- Adjusted EBITDA of $302 million and adjusted EBITDA margin of 18.6% for the full year
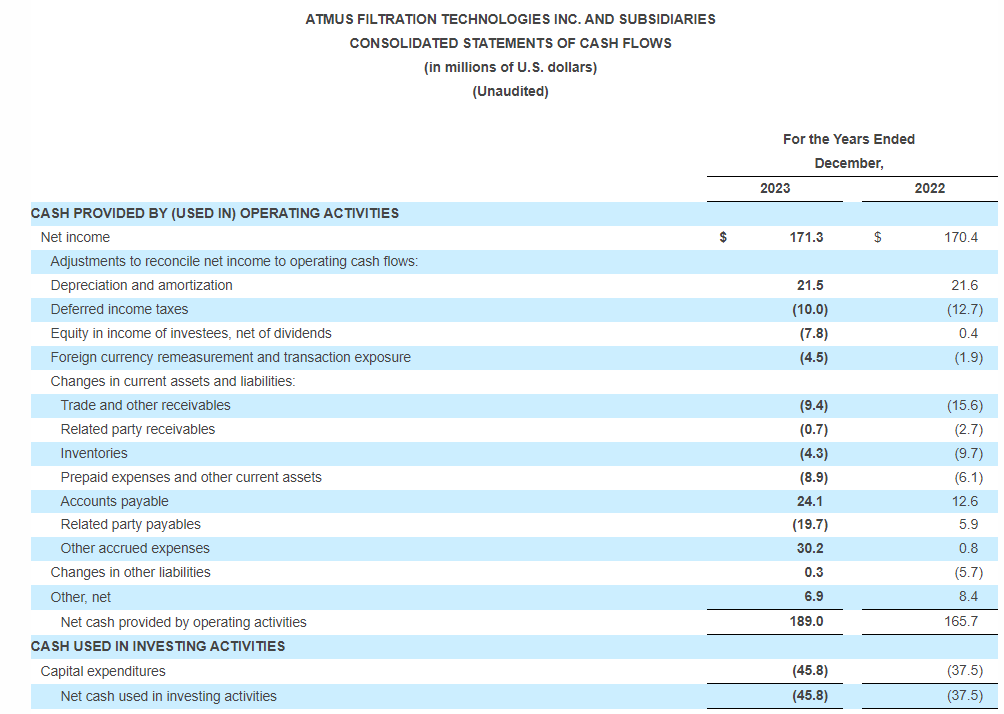
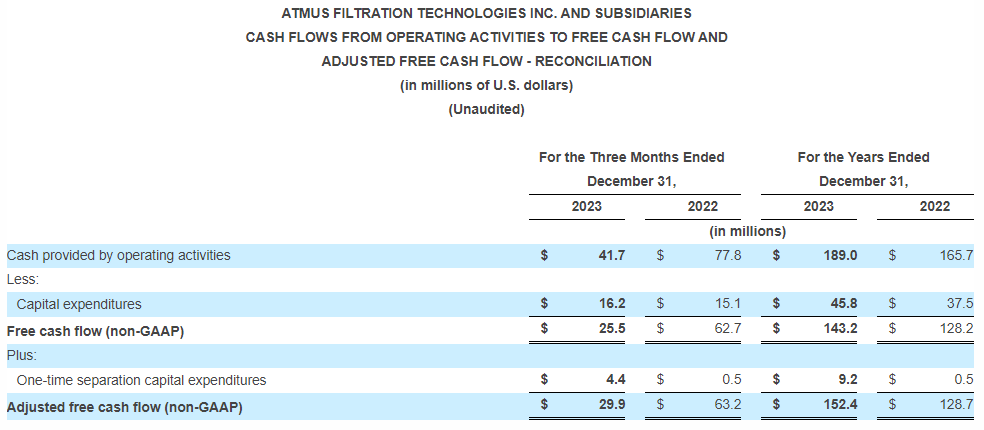
- Cash provided by operating activities was $42 million for the fourth quarter and $189 million for the full year
- Adjusted free cash flow was $30 million for the fourth quarter and $152 million for the full year
2024 Outlook
The company’s guidance for year 2024 is as follows:
- Revenue to be in the range of $1,610 million to $1,675 million
- Adjusted EBITDA margin to be in the range of 18.25 percent to 19.25 percent
- Adjusted earnings per share in the range of $2.10 to $2.35
“I am proud of the outstanding results the Atmus team has delivered for the fourth quarter and full year 2023.” said Steph Disher, Chief Executive Officer of Atmus. “We are focused on our customers and committed to disciplined execution of our growth strategy as we start the year in 2024.”
Fourth Quarter Results
For the fourth quarter of 2023, Atmus posted net sales of $400 million, compared to $385 million in the fourth quarter of 2022, an increase of approximately 4%. The increase in sales was primarily driven by increases in pricing and the favorable impacts of currency partially offset by a decrease in volume.
Gross margin was $106 million, compared to $83 million in the fourth quarter of fiscal year 2022, an increase of approximately 28%. Gross margin as a percent of net sales was 26.4% compared to 21.5% in the same period last year. The increase in gross margin and gross margin as a percent of net sales was driven by an increase in pricing, favorable freight and commodities costs, partially offset by lower volumes.
Adjusted EBITDA was $71 million, compared to $53 million in the fourth quarter of 2022. Adjusted EBITDA margin was 17.9% compared to 13.9% in the same period last year. Adjusted EBITDA in the fourth quarter of 2023 excludes $8 million of one-time costs associated with the separation of our business from Cummins Inc. compared to the prior year quarter which excludes $7 million of one-time costs.
Net income was $35 million, or $0.42 of diluted earnings per share in the fourth quarter of 2023, compared to $36 million, or $0.43 of diluted earnings per share in the same period last year.
Adjusted earnings per share was $0.49 in the fourth quarter of 2023, compared to $0.49 of adjusted earnings per share in the same period last year. Higher interest expense as a result of debt issued at our IPO lowered 2023 results.
The effective tax rate for the fourth quarter was 26.3%.
Cash provided by operating activities was $42 million in the fourth quarter of 2023, compared to cash provided by operating activities of $78 million in the fourth quarter of 2022.
Full Year 2023 Results
For the full year 2023, Atmus posted sales of $1,628 million, up $66 million, or approximately 4% from the prior year. The increase in sales was primarily driven by an increase in pricing partially offset by a decrease in volume.
Gross margin was $433 million, compared to $359 million for year 2022, an increase of approximately 20%. Gross margin as a percent of net sales was 26.6% compared to 23.0% in the same period last year. The increase in gross margin and gross margin as a percent of net sales was driven by an increase in pricing, favorable freight and commodities costs, partially offset by lower volumes and unfavorable manufacturing and other costs.
Adjusted EBITDA was $302 million, compared to $243 million in 2022. Adjusted EBITDA margin was 18.6% compared to 15.6% in the same period last year. Adjusted EBITDA in 2023 excludes $29 million of one-time costs associated with the separation of our business from Cummins Inc. compared to the prior year which excludes $9 million of one-time costs.
Net income was $171 million, or $2.05 of diluted earnings per share in 2023, compared to $170 million, or $2.05 of diluted earnings per share last year.
Adjusted earnings per share was $2.31 in 2023, compared to $2.13 of adjusted earnings per share last year. Higher interest expense as a result of debt issued at our IPO lowered 2023 results.
The effective tax rate for 2023 was 24.3%
Cash provided by operating activities was $189 million in 2023, compared to cash provided by operating activities of $166 million in 2022.
Fourth Quarter and Full Year 2023 Conference Call and Webcast
Atmus will host a conference call and webcast to discuss the company's fourth quarter and full year 2023 results on Wednesday, February 14, 2024, at 10:00 a.m. CT.
A live webcast and replay of the conference call can be accessed from the Atmus investor relations website at http://investors.atmus.com.
About Atmus Filtration Technologies Inc.
Atmus Filtration Technologies Inc. is a global leader in filtration and media solutions. For more than 65 years, the company has combined its culture of innovation with a rich history of designing and manufacturing filtration solutions. With a presence on six continents, Atmus serves customers across truck, bus, agriculture, construction, mining, marine and power generation vehicle and equipment markets, along with providing comprehensive aftermarket support and solutions. Headquartered in Nashville, Tennessee (U.S.), Atmus employs approximately 4,500 people globally who are committed to creating a better future by protecting what is important. Learn more at https://www.atmus.com.
Forward-looking disclosure statement
This press release contains forward-looking statements within the meaning of the safe harbor provisions of the United States Private Securities Litigation Reform Act of 1995, including, without limitation, those that are based on current expectations, estimates and projections about the industries in which we operate and management’s views, plans, objectives, projections, beliefs and assumptions. Forward-looking statements may be identified by the use of words such as “anticipates,” “expects,” “forecasts,” “intends,” “plans,” “believes,” “seeks,” “estimates,” “could,” “should,” “may” or words of similar meaning. All statements other than statements of historical fact are forward-looking statements, including, without limitation, statements regarding the outlook for our future business and financial performance, discussions of future operations, our strategy for growth and market position. These statements are not guarantees of future performance and involve certain risks, uncertainties and assumptions, which are difficult to predict. If the underlying assumptions prove correct, or known or unknown risks or uncertainties materialize, our actual outcomes, results and financial condition may differ materially from what is expressed, implied or forecasted in such forward-looking statements. Risks and uncertainties include, but are not limited to, those reflected in the section titled “Risk Factors” in our final prospectus relating to our initial public offering, as filed with the Securities and Exchange Commission (the “SEC”) on May 26, 2023, relating to our Registration Statement on Form S-1, , and subsequent filings, all of which are on file with the SEC. You are cautioned not to place undue reliance on forward-looking statements. The forward-looking statements made herein are made only as of the date hereof and we undertake no obligation to publicly update or to revise any forward-looking statement, whether as a result of new information, future developments or otherwise, except as may be required by law.
Non-GAAP measures
We use non-GAAP financial information and believe it is useful to investors as it provides additional information to facilitate comparisons of historical operating results, identify trends in our underlying operating results and provide additional insight and transparency on how we evaluate our business. We use non-GAAP financial measures to budget, make operating and strategic decisions and evaluate our performance. We have detailed the non-GAAP adjustments that we make in our non-GAAP definitions below. We believe the non-GAAP measures should always be considered along with the related U.S. GAAP financial measures. We have provided the reconciliations between the U.S. GAAP and non-GAAP financial measures and we also discuss our underlying U.S. GAAP results throughout our Management’s Discussion and Analysis of Financial Condition and Results of Operations in our Annual Report on Form 10-K.
Our primary non-GAAP financial measures are listed below and reflect how we evaluate our current and prior-year operating results. As new events or circumstances arise, these definitions could change. When our definitions change, we provide the updated definitions and present the related non-GAAP historical results on a comparable basis.
- “EBITDA” is defined as earnings or losses before interest expense, income taxes, depreciation and amortization and “EBITDA margin” is defined as EBITDA as a percent of net sales. We believe EBITDA and EBITDA margin are useful measures of our operating performance as they assist investors and debt holders in comparing our performance on a consistent basis without regard to financing methods, capital structure, income taxes or depreciation and amortization methods, which can vary significantly depending upon many factors. Additionally, we believe these metrics are widely used by investors, securities analysts, ratings agencies and others in our industry in evaluating performance.
- “Adjusted EBITDA” is defined as EBITDA after adding back certain one-time expenses, reflected in cost of sales and selling, general and administrative expenses, associated with becoming a standalone public company and “Adjusted EBITDA margin” is defined as Adjusted EBITDA as a percent of net sales. We believe Adjusted EBITDA and Adjusted EBITDA margin are useful measures of our operating performance as it allows investors and debt holders to compare our performance on a consistent basis without regard to one-time costs attributable to our becoming a standalone public company.
- “Adjusted earnings per share” is defined as diluted earnings per share (the most comparable U.S. GAAP financial measure) after adding back certain one-time expenses, reflected in cost of sales and selling, general and administrative expenses, associated with becoming a standalone public company less the related tax impact of the same one-time expenses. We believe Adjusted earnings per share provides improved comparability of underlying operating results.
- “Free cash flow” is defined as cash flows provided by (used for) operating activities less capital expenditures and “Adjusted free cash flow” is defined as Free cash flow after adding back certain one-time capital expenditures associated with becoming a standalone public company. We believe Free cash flow and Adjusted free cash flow are useful metrics used by management and investors to analyze our ability to service and repay debt and return value to shareholders.
The metrics defined above are not in accordance with, or alternatives for, U.S. GAAP financial measures and may not be consistent with measures used by other companies. It should be considered supplemental data; however, the amounts included in the EBITDA, EBITDA margin, Adjusted EBITDA, Adjusted EBITDA margin, Adjusted earnings per share, Free cash flow and Adjusted free cash flow calculations are derived from amounts included in the consolidated statements of net income and cash flows.
We do not consider our non-GAAP financial measures as superior to, or a substitute for, the equivalent measures calculated and presented in accordance with GAAP. Some of the limitations are: such measures do not reflect our cash expenditures, or future requirements for capital expenditures or contractual commitments; such measures do not reflect changes in, or cash requirements for, our working capital needs; such measures do not reflect the interest expense or the cash requirements necessary to service interest or principal payments on our debt; although depreciation and amortization are non-cash charges, the assets being depreciated and amortized will often have to be replaced in the future and such measures do not reflect any cash requirements for such replacements; and other companies in our industry may calculate such measures differently than we do, limiting their usefulness as comparative measures. To properly and prudently evaluate our business, we encourage you to review the unaudited condensed consolidated financial statements included in our SEC filings and not rely on a single financial measure to evaluate our business.
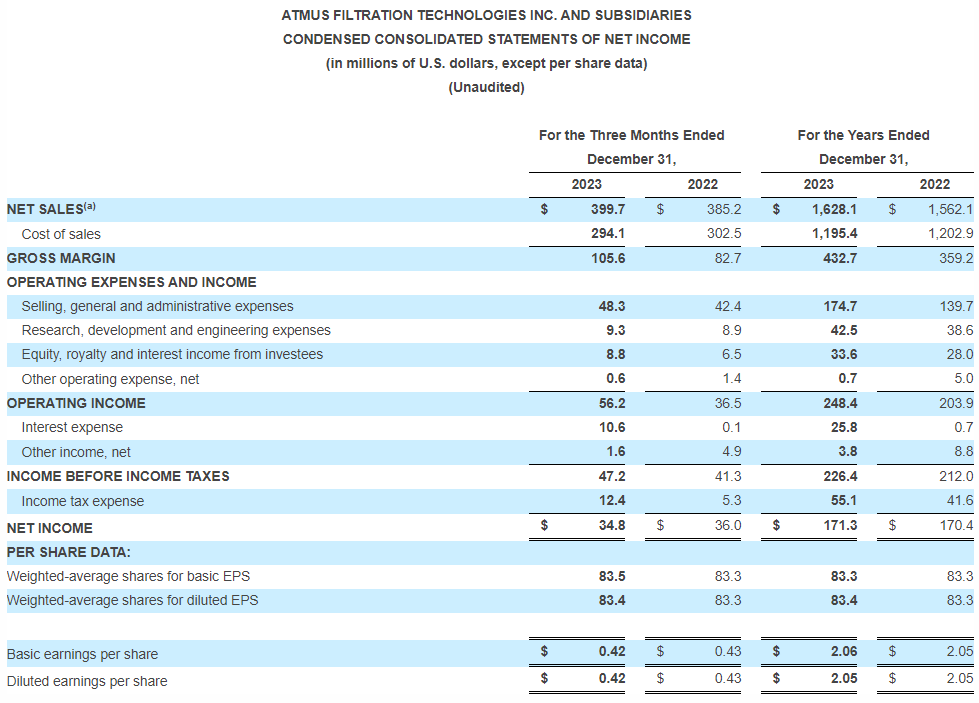
| (a) Includes sales to related parties of $390.8 million and $344.9 million for the years ended December 31, 2023 and 2022, respectively. |
| (a) Primarily comprised of one-time expenses related to information technology, warehousing and human resources separation costs. |
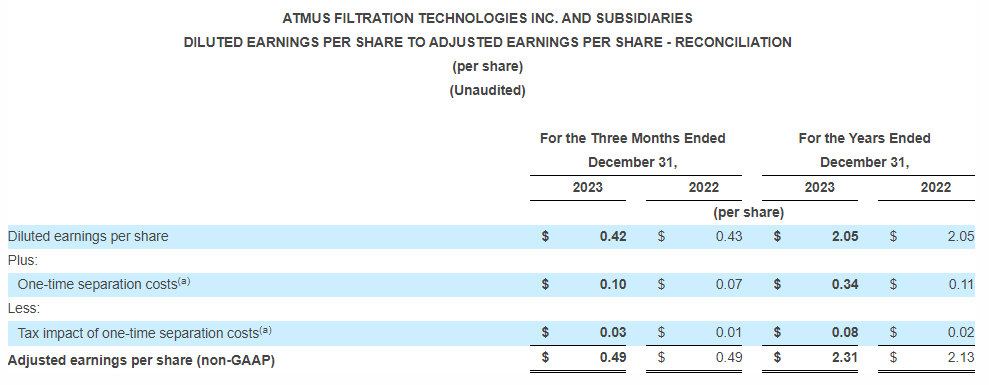
| (a) | Primarily comprised of one-time expenses related to information technology, warehousing and human resources separation costs and the related tax impact of those expenses. The tax impact of one-time separation costs for the years ended December 31, 2023, and 2022 were $6.9 million and $1.8 million. respectively. |
Contacts:
Investor relations:
Todd Chirillo
[email protected]
Media relations:
Keri Moenssen
[email protected]


